PHP is probably one of the most popular programming languages. Especially if we talk about the web development. Following the intention to complexity reduction, dozens of PHP frameworks have been created. One of the most popular among them is Laravel. You can check this framework popularity survey made by sitepoint to make sure that Laravel at least deserves your attention.

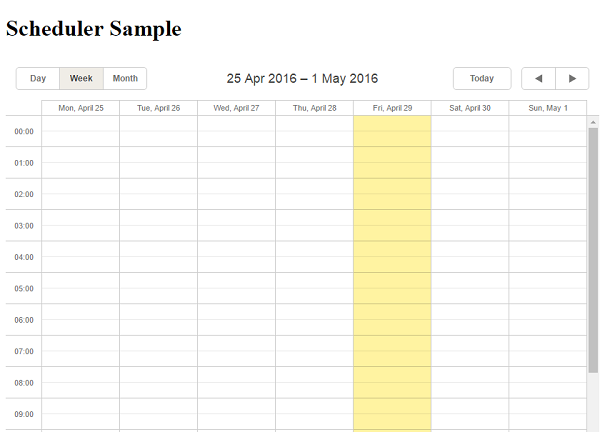
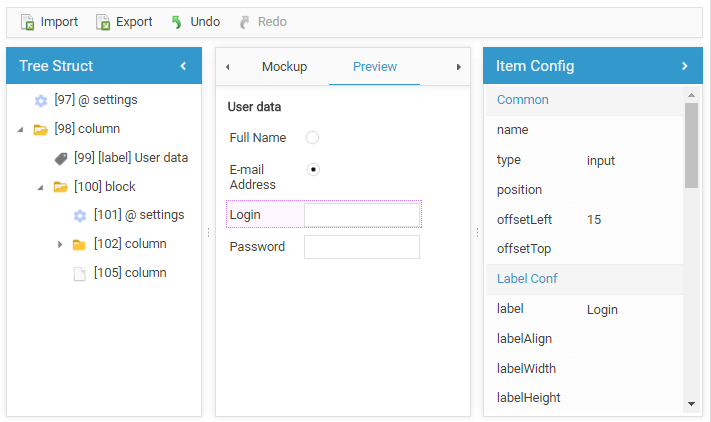
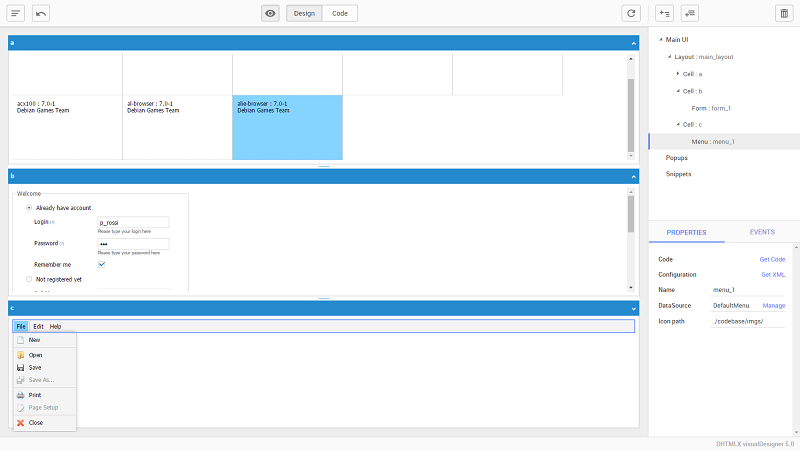
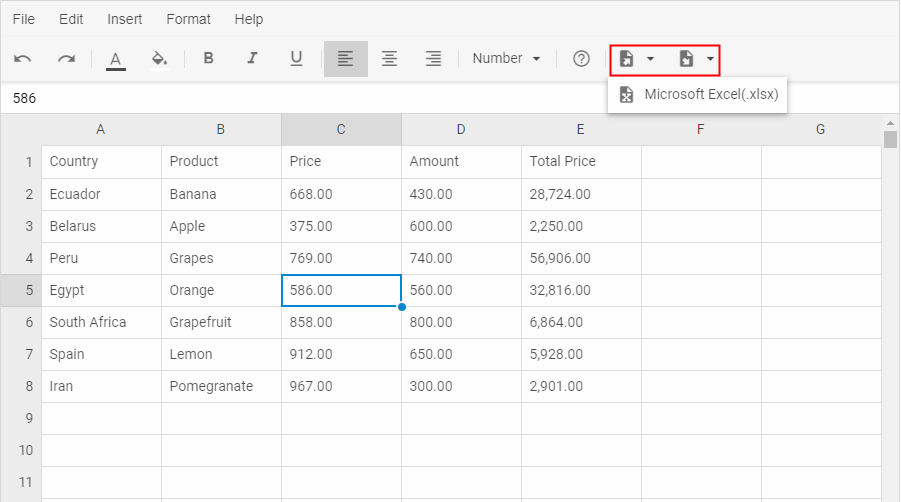
Spoiler! That’s how dhtmlxGrid will look like in the version 5.0 ;)
This article’s aim is to describe the basics of Laravel usage. This framework was created for the development of web applications following the model–view–controller (MVC) architectural pattern. One of the core features of Laravel is a modular packaging system that allows adding new components to your project. Since we’re not interesting in the creation of a simple “Hello, World!” application, we’ll use this feature to create something that looks like an actual web app. We’ll use our dhtmlxGrid component for our task. It’s a JavaScript grid control that you can use for creating Ajax-enabled tables with rich in-cell editing, built-in filtering, searching, and grouping capabilities.
dhtmlxGrid doesn’t require a big amount of code for using it, and one article will be enough to create a working example.
Step 1. Using Composer to Install Laravel
Composer is a package manager for PHP that we can use to create a new Laravel project and install the required dhtmlxGrid files. If you use a Linux distribution, Composer is possibly available through a repository, and you can install it using your package manager like you install any other package. Otherwise, you can follow this installation guide.
There’s a well-written guide that describes in detail how you can install Laravel, create and configure a new project. We’ll use previously installed Composer.
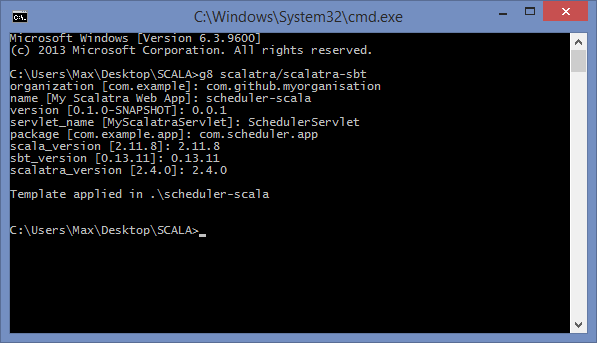
Run in your terminal:
This command will create a new Laravel project in a directory named dhtmlxGrid. If you want, you can check if everything works well. Open the newly created directory and run the server:
php artisan serve
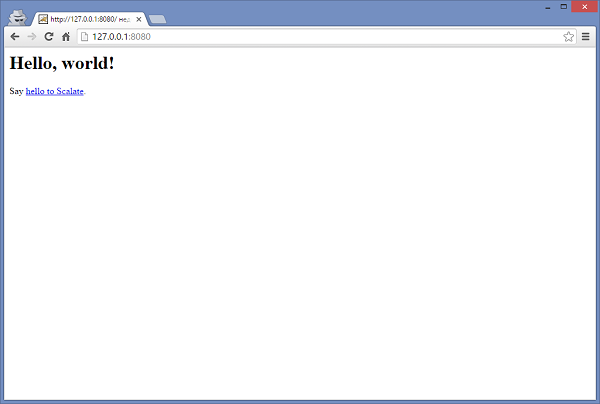
Now you can open http://localhost:8000/ in your browser. Here’s what you should get:

Everything works which means that we can return to our application. Now we need to install dhtmlxConnector which enables access to external data sources. We need it for saving and loading the data. The best thing about using Laravel is the possibility to add this component to a project via composer using a single command.
You can use the Packagist website if you want to find a proper package. You can find comprehensive information about the component that you want to use. Composer installation command, requirements, short description, link to the documentation page, etc.:

In our case, to install dhtmlxConnector you should use the following command:
Step 2. Get the dhtmlxGrid Package
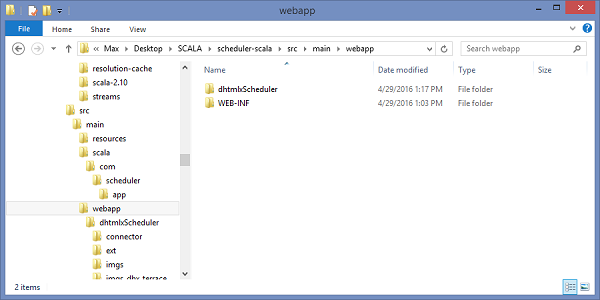
After the installation complete, we should download the package with dhtmlxGrid. Within the public folder of your project create a new directory named dhtmlxGrid and unpack the content of the package into it.
Step 3. Create the Database
You can download the pre-created zip archive that contains the database dump file we can use. Unpack the archive and you’ll see the dhtmlx_samples.sql file.
Now, we can create a new database. If you use MySQL run:
After you insert the password, you can create a new database and import the data from the dump file into it:
USE grid;
\. /path/to/file/dhtmlx_samples.sql
After you finish with this task, we can finally create the application.
Step 4. Create a Model
We need to specify the appropriate model class to get the access to the data. Create a new file named Grid.php within the app directory of your project:
namespace App;
use Illuminate\Database\Eloquent\Model;
class Grid extends Model
{
protected $table = "scheduler_events";
public $primaryKey = "event_id";
public $timestamps = false;
}
That’s it. Now we can create the View Object.
Step 5. Create the View Object
Within the resources/views directory, create a new file named grid.php:
<head>
<script src="dhtmlxGrid/codebase/dhtmlxgrid.js"></script>
<link rel="stylesheet" href="dhtmlxGrid/codebase/dhtmlxgrid.css">
</head>
<body>
<div id="grid_here" style="width: 600px; height: 400px;"></div>
<script type="text/javascript" charset="utf-8">
mygrid = new dhtmlXGridObject('grid_here');
mygrid.setHeader("Start date,End date,Text");
mygrid.init();
mygrid.load("./grid_data");
var dp = new dataProcessor("./grid_data");
dp.init(mygrid);
</script>
</body>
Step 6. Create the Controller
The controller that we want to create will do two things: load the view, and load and process the data.
To load and process data we will use GridConnector:
$connector->configure(new Grid(),"event_id","start_date,end_date,event_name");
$connector->render();
The GridConnector constructor takes 2 parameters:
- null – null is passed, as a model, not a database is used;
- $PHPLaravel – the module for working with PHP, the hardcoded value;
The configure method configures the GridConnector object without rendering data and takes 5 parameters:
- new $modelName – the method creating a model. In this case, new Grid() that we have defined earlier;
- $id – the name of the id field;
- $text – a comma separated list of rendered data fields;
- $extra – (optional) a comma separated list of extra fields;
- $relation_id – (optional) used for building hierarchy in case of Tree and TreeGrid;
Now, within the app/Http/Controllers folder create a new file, GridController.php:
namespace App\Http\Controllers;
use App\Grid;
use Dhtmlx\Connector\GridConnector;
class GridController extends Controller
{
public function data() {
$connector = new GridConnector(null, "PHPLaravel");
$connector->configure(
new Grid(),
"event_id",
"start_date, end_date, event_name"
);
$connector->render();
}
}
Step 7. Final Configuration
We should edit the .env file that you can find within the root file of your project. We need to change four lines to give Laravel access to the previously created database:
DB_DATABASE=grid
DB_USERNAME=root
DB_PASSWORD=yourpassword
Now, let’s deal with routes. If you open the app/Http/routes.php file you’ll find the default route configuration that may look like this:
return view('welcome');
});
This code will perform the GET request after you open your project in a browser. As a result, the welcome view from the resources/views folder will be returned. We should replace it with the previously created view, grid.php. The other step is to use GridController to save and load data. All you need to do is to replace the existing route with the following:
return view('grid');
});
Route::match(['get', 'post'], '/grid_data', "GridController@data");
One more step left. Laravel protects your application from cross-site request forgeries by generating a CSRF “token” for each active user session managed by the application. You can read more about the mechanisms of protection on this page if you want, but what we need to do now is to exclude one particular URI from CSRF protection. The one that triggered when created data is supposed to be saved. We need to add a proper value to the $except property in the file app/Http/Middleware/VerifyCsrfToken.php:
'grid_data'
];
Step 8. Run the Application
Open your project’s directory and run in terminal:
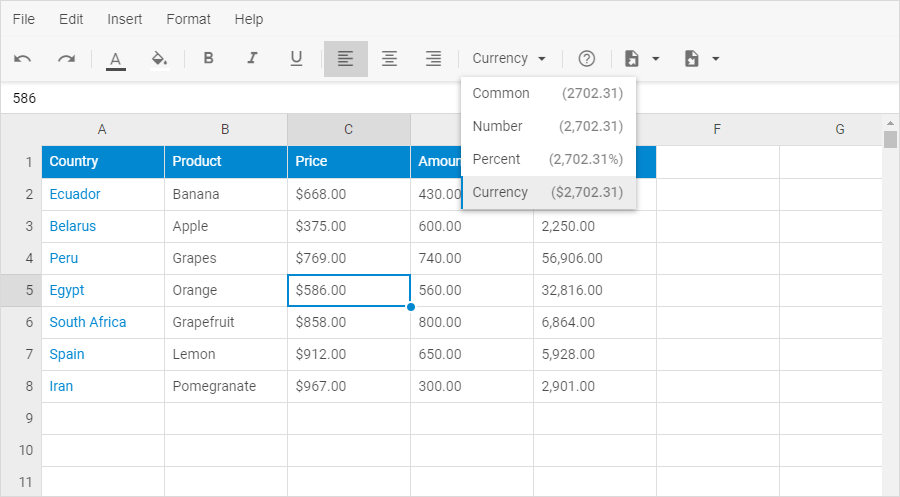
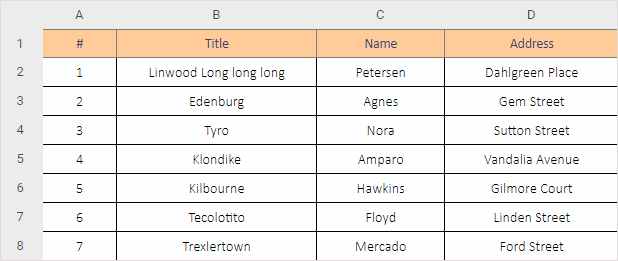
Open http://localhost:8000/ in your browser and you’ll see the working dhtmlxGrid:

Here’s the table that contains the data from our database.
That’s all. We hope you have enjoyed the tutorial.
The post JavaScript Data Grid with Laravel 5 Usage Guide appeared first on DHTMLX Blog.


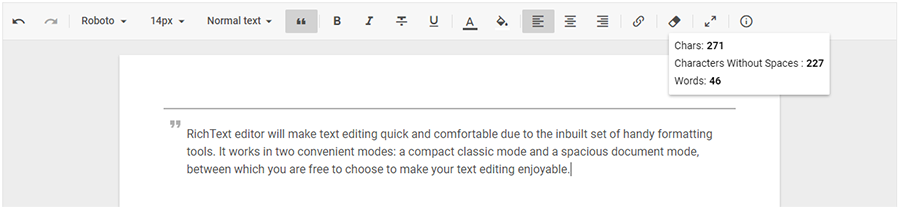
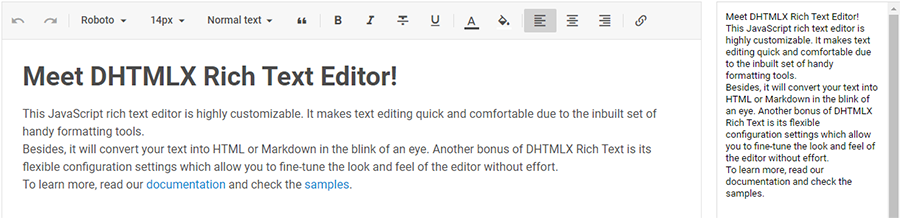
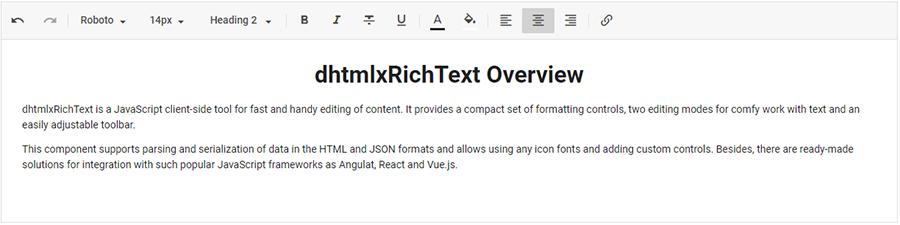 Classic mode
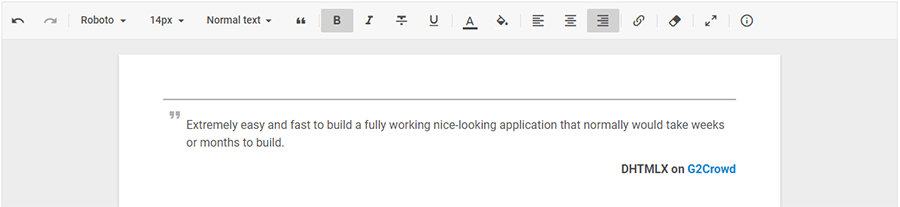
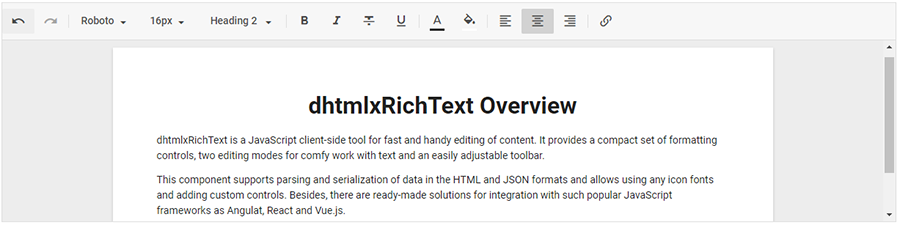 Document mode
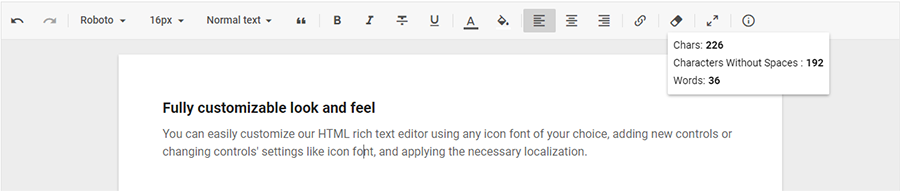
 Toolbar with all blocks of controls

 Check the samples with
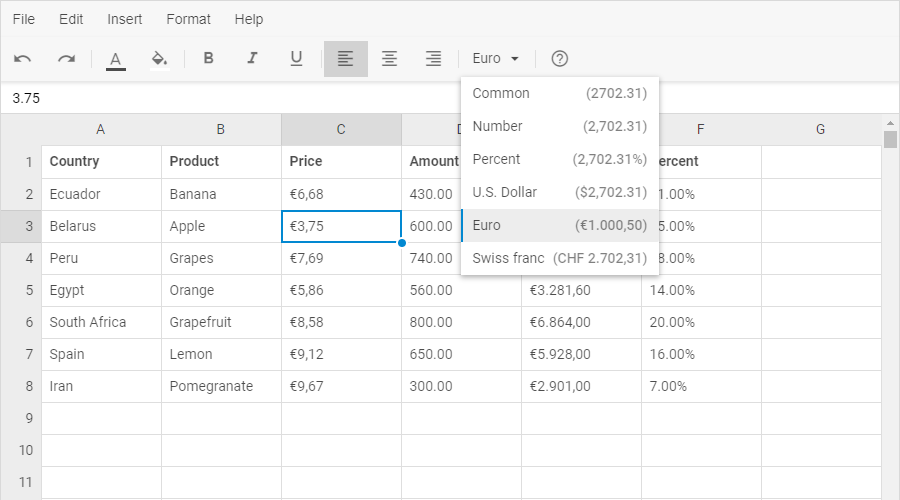


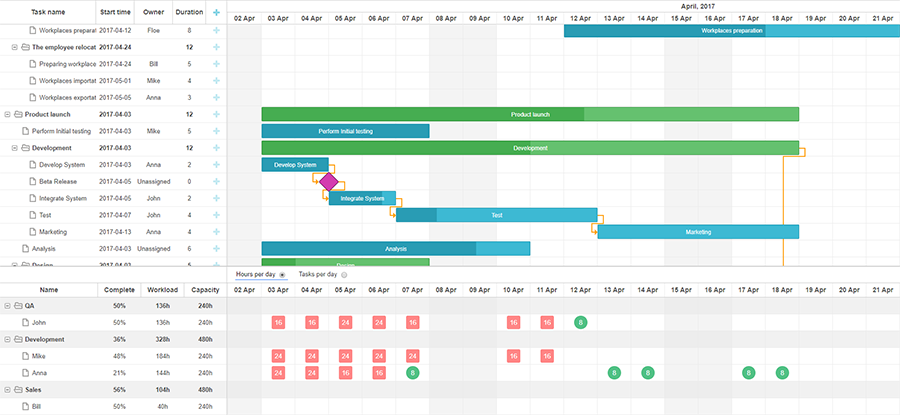
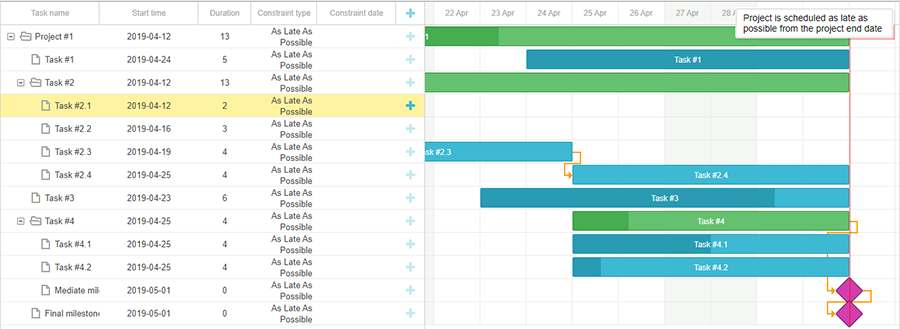
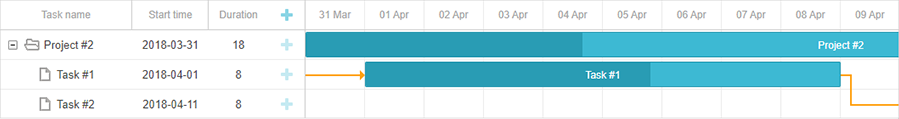 Basic Grid configuration in DHTMLX Gantt
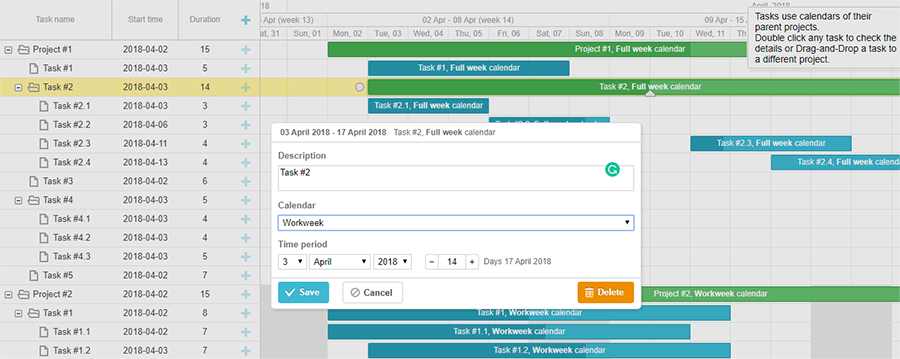
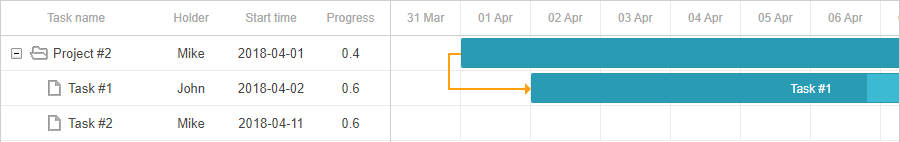 Custom columns in the grid of dhtmlxGantt
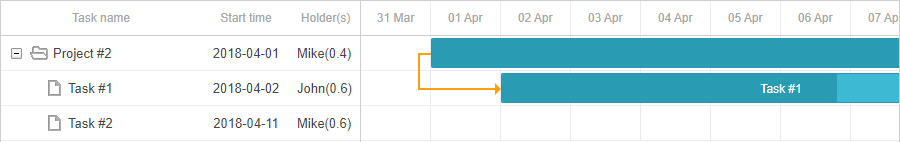 The template property in dhtmlxGantt
 Detailed view of the grid in Gantt